Turning Data into Direction: Insights from the Bike Sales
Dashboard
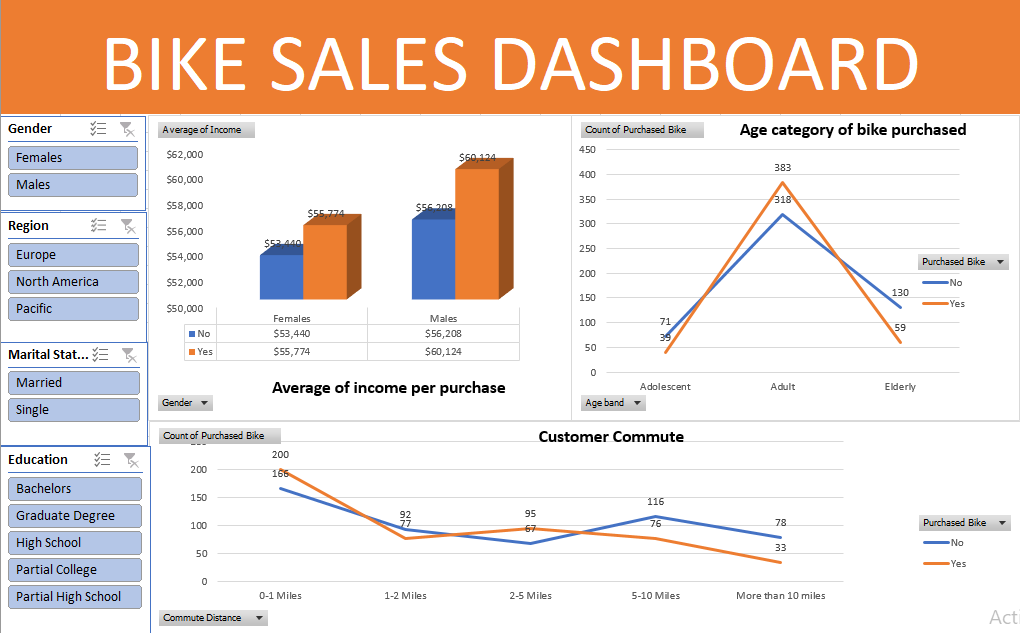
One of the strongest patterns observed in the dashboard is the
relationship between income and purchasing decisions. Customers
who purchased bikes consistently show higher average incomes than
those who did not. Male customers who purchased bikes had the
highest average income overall, followed by female buyers. In both
gender groups, buyers earned noticeably more than non-buyers. This
indicates that income level plays a significant role in
determining whether a customer will purchase a bike.
This insight suggests that bikes are perceived not only as
transportation tools but also as lifestyle or convenience
investments, typically adopted by customers with higher disposable
income.
Key Performance Indicators to Track
To effectively monitor and improve performance, businesses should
focus on several key metrics:
Total number of bikes sold
Purchase conversion rate (buyers vs non-buyers)
Average income of purchasing customers
Purchase rate by age group and gender
Conversion rate by commute distance
Regional sales performance
Tracking these KPIs helps businesses measure growth, identify
top-performing segments, and refine marketing strategies.
Pizza Sales Performance: End-to-End SQL & Power BI Portfolio
Project
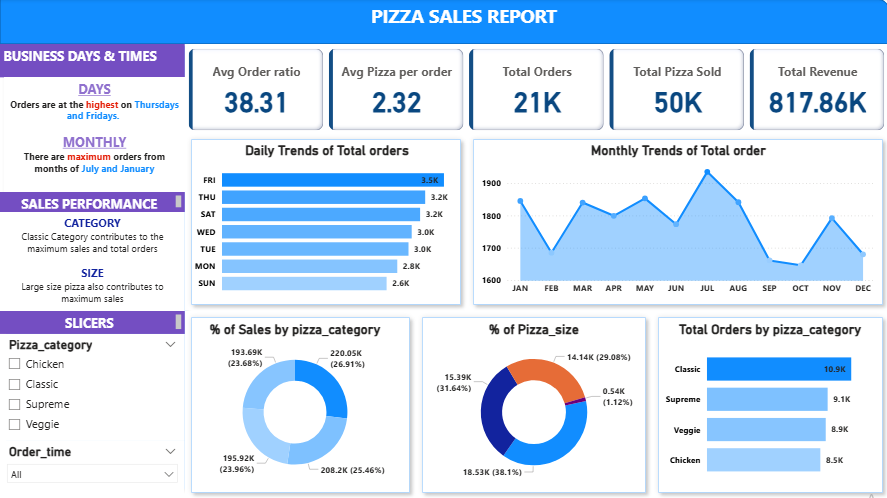
A pizza restaurant owner wants to gain a deeper understanding of
their business performance to make data-driven decisions. The
objective of this project was to analyze a year's worth of pizza
sales data (2015) to uncover actionable insights regarding
operational bottlenecks, seasonal trends, and product
performance.
Tools Used
MS SQL Server: Used for initial data import, data exploration, and
writing analytical queries to cross-validate the final dashboard
metrics.
Power BI Desktop: Utilized for data visualization, building an
interactive two-page dashboard, and applying advanced conditional
formatting.
Power Query: Employed for data cleaning and transformation (e.g.,
standardizing pizza size abbreviations, extracting day and month
names from date fields).
DAX (Data Analysis Expressions): Used to create custom
calculations and aggregate measures for the KPIs.
Managing Financial Exposure: Insights from the Credit Risk
Analysis Report
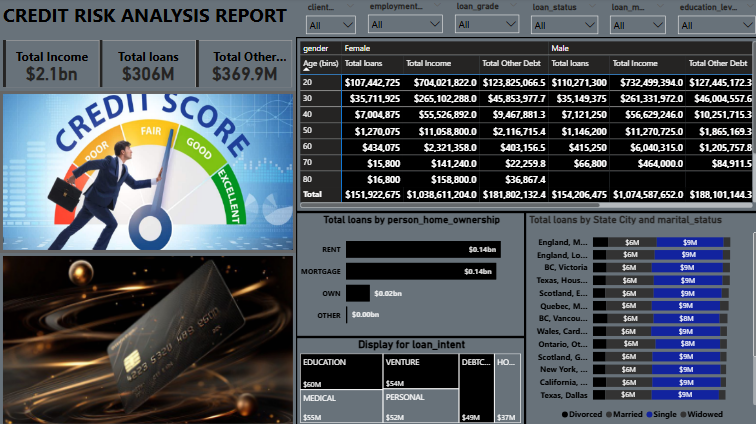
In financial services, understanding credit behavior is essential
for maintaining profitability while minimizing default risk. The
Credit Risk Analysis Report provides a comprehensive view of
borrower income, loan distribution, demographic patterns, and
credit exposure across multiple dimensions. By examining these
insights, lenders can strengthen risk assessment models, optimize
loan allocation, and improve portfolio stability.
Tools Used
Power BI Desktop: Used for data modeling, DAX (Data Analysis
Expressions), and interactive visualization.
Power Query: Utilized for data cleaning, transformation (handling
nulls, merging columns), and data type optimization.
DAX: Implemented for creating Key Performance Indicators (KPIs)
and complex measures like Total Loans, Total Income, and Debt
analysis.
Data Source: Credit Risk Dataset (CSV/Excel).
These KPIs enable proactive risk monitoring rather than reactive
loss management.
The Architecture of a Digital Portfolio
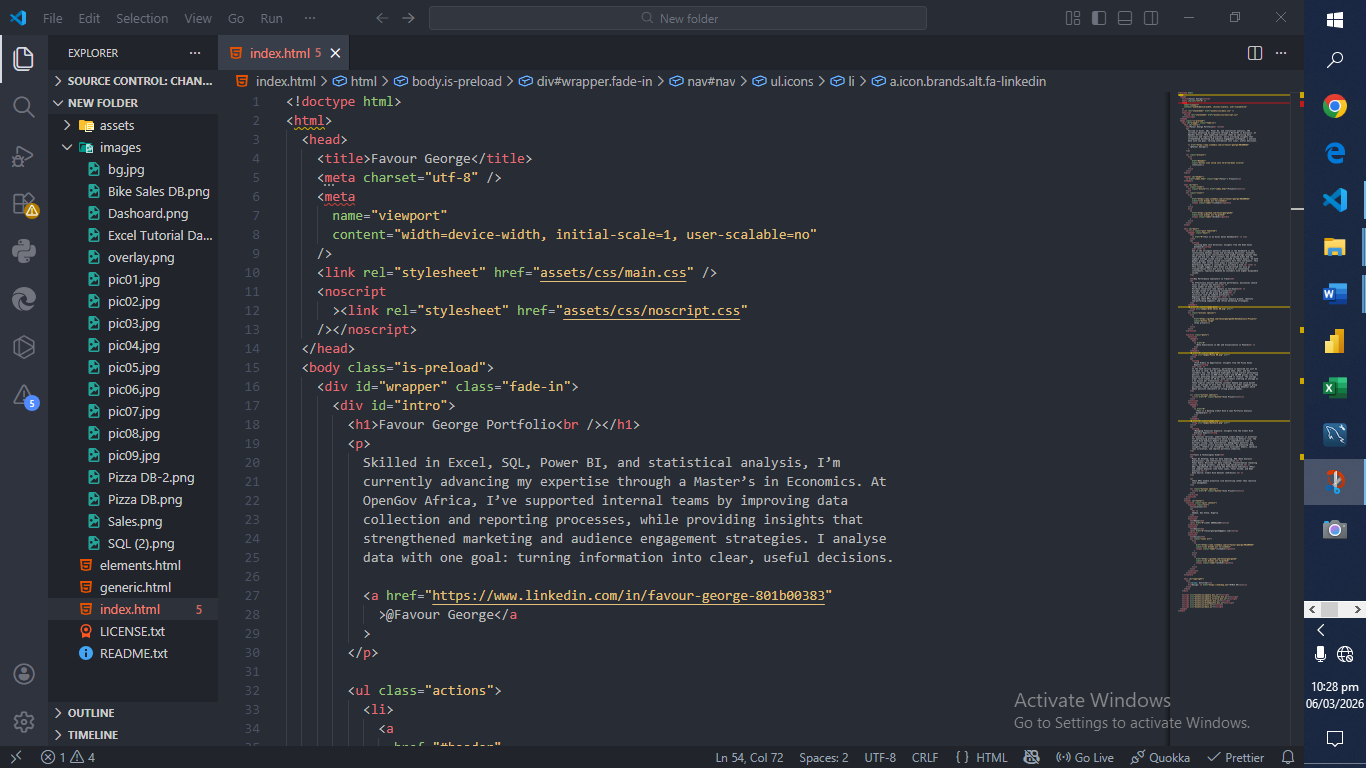
To bridge the gap between complex statistical analysis and
stakeholder accessibility, I undertook the challenge of building a
custom portfolio website from the ground up. Utilizing a core
stack of HTML5 and CSS3, this project was designed not just as a
resume, but as a functional demonstration of my technical
literacy.
Beyond the code, the portfolio serves as a gallery for my diverse
analytical projects. It features specialized dashboards, such as
my Bike Sales and Pizza Sales databases, which highlight my
proficiency in SQL and Power BI. By hosting the site on GitHub, I
have integrated my development workflow with version control,
demonstrating a professional approach to project management.
Ultimately, this site stands as a testament to my dual identity as
a Master’s student in Economics and a data professional dedicated
to turning information into useful, evidence-based decisions.